BMW X1 vs Ford Taurus
Full-size sedan · 2015–2025 · 985 federal complaints
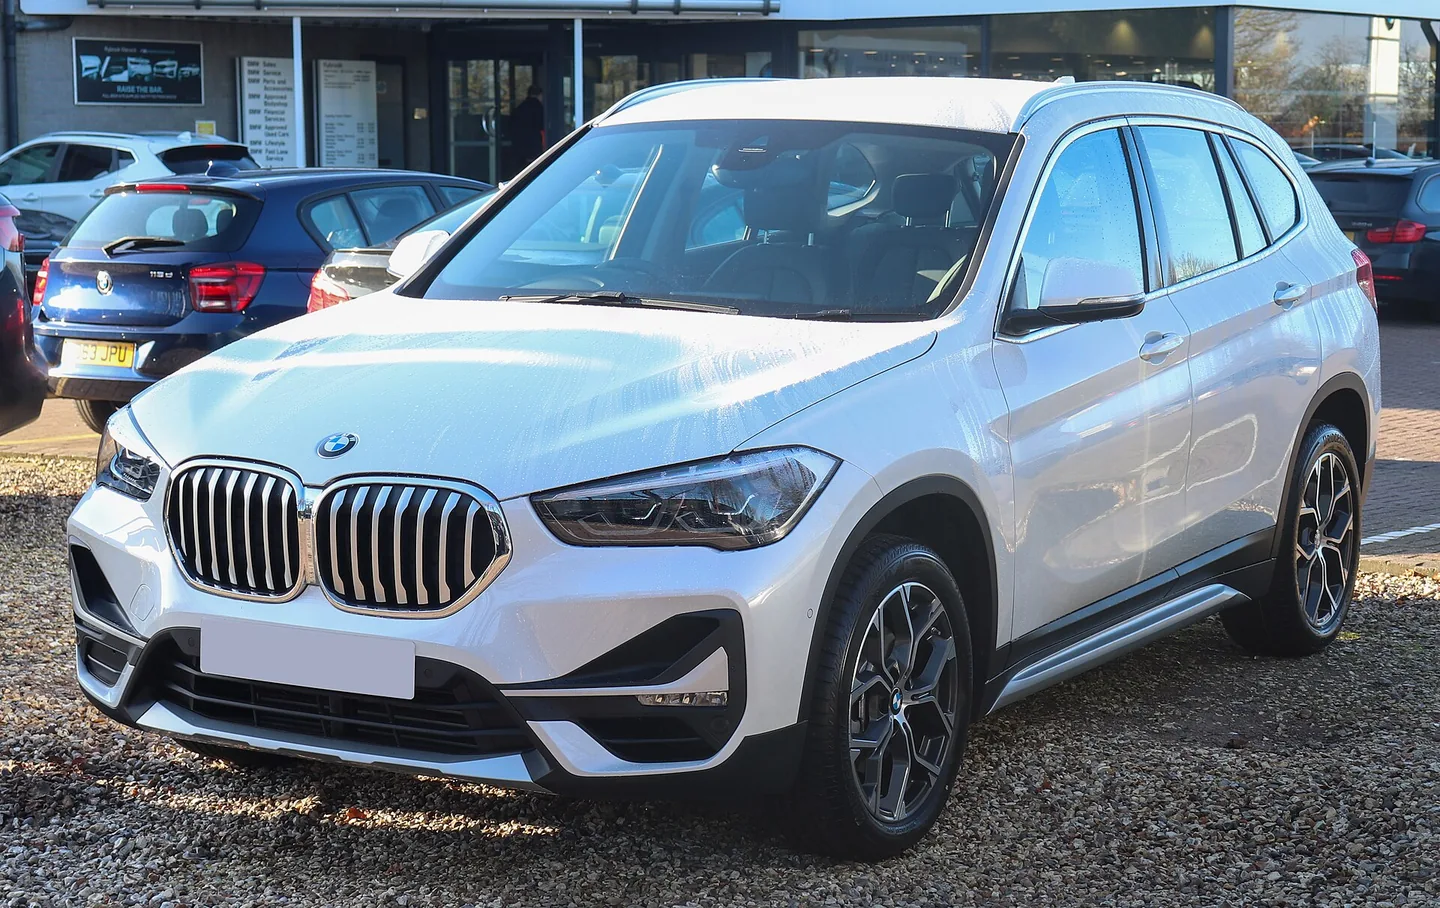
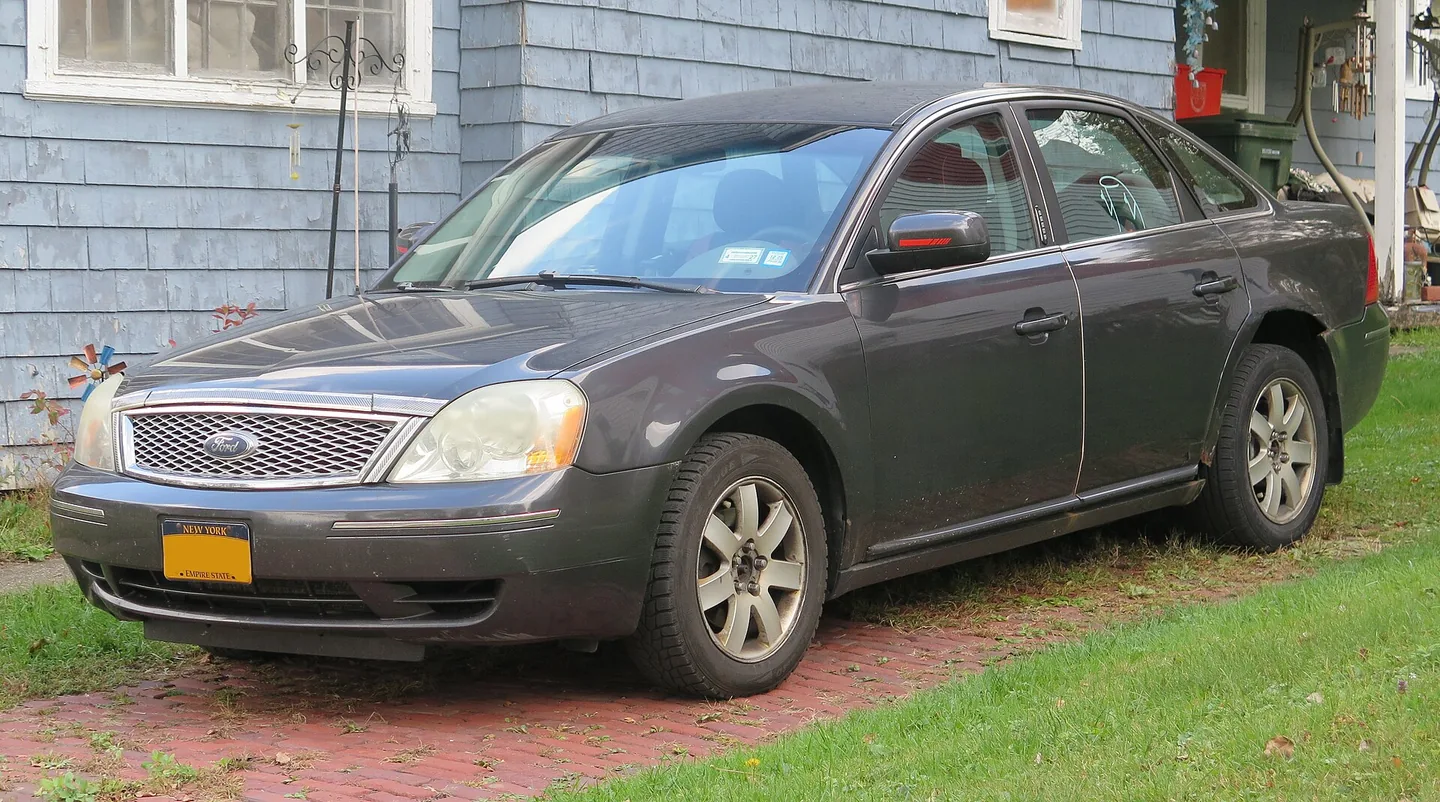
Ford Taurus
429 complaints · 2 engines
Most-complained engine: TI-VCT · 3.5L V6
Full breakdown for Ford Taurus →At a glance
Side by side. EPA figures are the model's median across its test variants; price is the base-trim MSRP (CarAPI), median across covered model years.
| BMW X1 | Ford Taurus | |
|---|---|---|
| Base MSRP | $34,350 | $27,345 |
| Most common engine | 2.0L I4 | TI-VCT · 3.5L V6 |
| Induction | Turbo | Naturally aspirated |
| Fuel economy | 26 MPG | 21 MPG |
| Running cost | $2,900/yr | $2,950/yr |
| Low emissions | 337 g/mi | 428 g/mi |
| Cabin space | — | 102 cu ft |
| Cargo space | — | 20 cu ft |
| Displacement | 2.0 L | 3.5 L |
| NHTSA overall crash rating | ★★★★ (2025) | ★★★★★ (2019) |
| Rollover risk (NHTSA) | 17.4% | 11.3% |
| Engines with enough data | 1 | 2 |
Side by side
Both cars scored as percentiles within Full-size sedan, so the shapes are directly comparable. Built from EPA test data.
What each one's complaints are about
Showing each car's highest-volume engine. Share of component mentions — not a failure rate, and not a ranking between the two.
BMW X1
Ford Taurus
How often each one's complaints involve a fire, crash or injury
Shares of each car's own complaints — sales volume cancels out of a within-car ratio, so these two can be compared. The vertical mark is the all-vehicle average.
all vehicles — Fire 1.1% · Crash 4.4% · Injury 2.6%
Every engine with enough data
Complaint counts per engine are shown for scale only — they track how many were sold, not how often they fail.
BMW X1
- 2.0L I4Turbo553
Ford Taurus
- TI-VCT · 3.5L V6Naturally aspirated360
- GTDI · 3.5L V6Turbo52
Recalls where NHTSA said stop driving or park outside
The severest recall class only. Model-level, manufacturer-confirmed. Recall repairs are free at any franchised dealer, whatever the car's age.
BMW X1
None on record for this model.
Ford Taurus
None on record for this model.
One car having more complaints than the other mostly reflects how many were sold, not how often they break. Compare each car's own mix of problems — not the totals.